See your financial data your way
Clear, customizable charts and reports. Track performance by property, platform, or time period — full control over how you view your business finances.
Get started
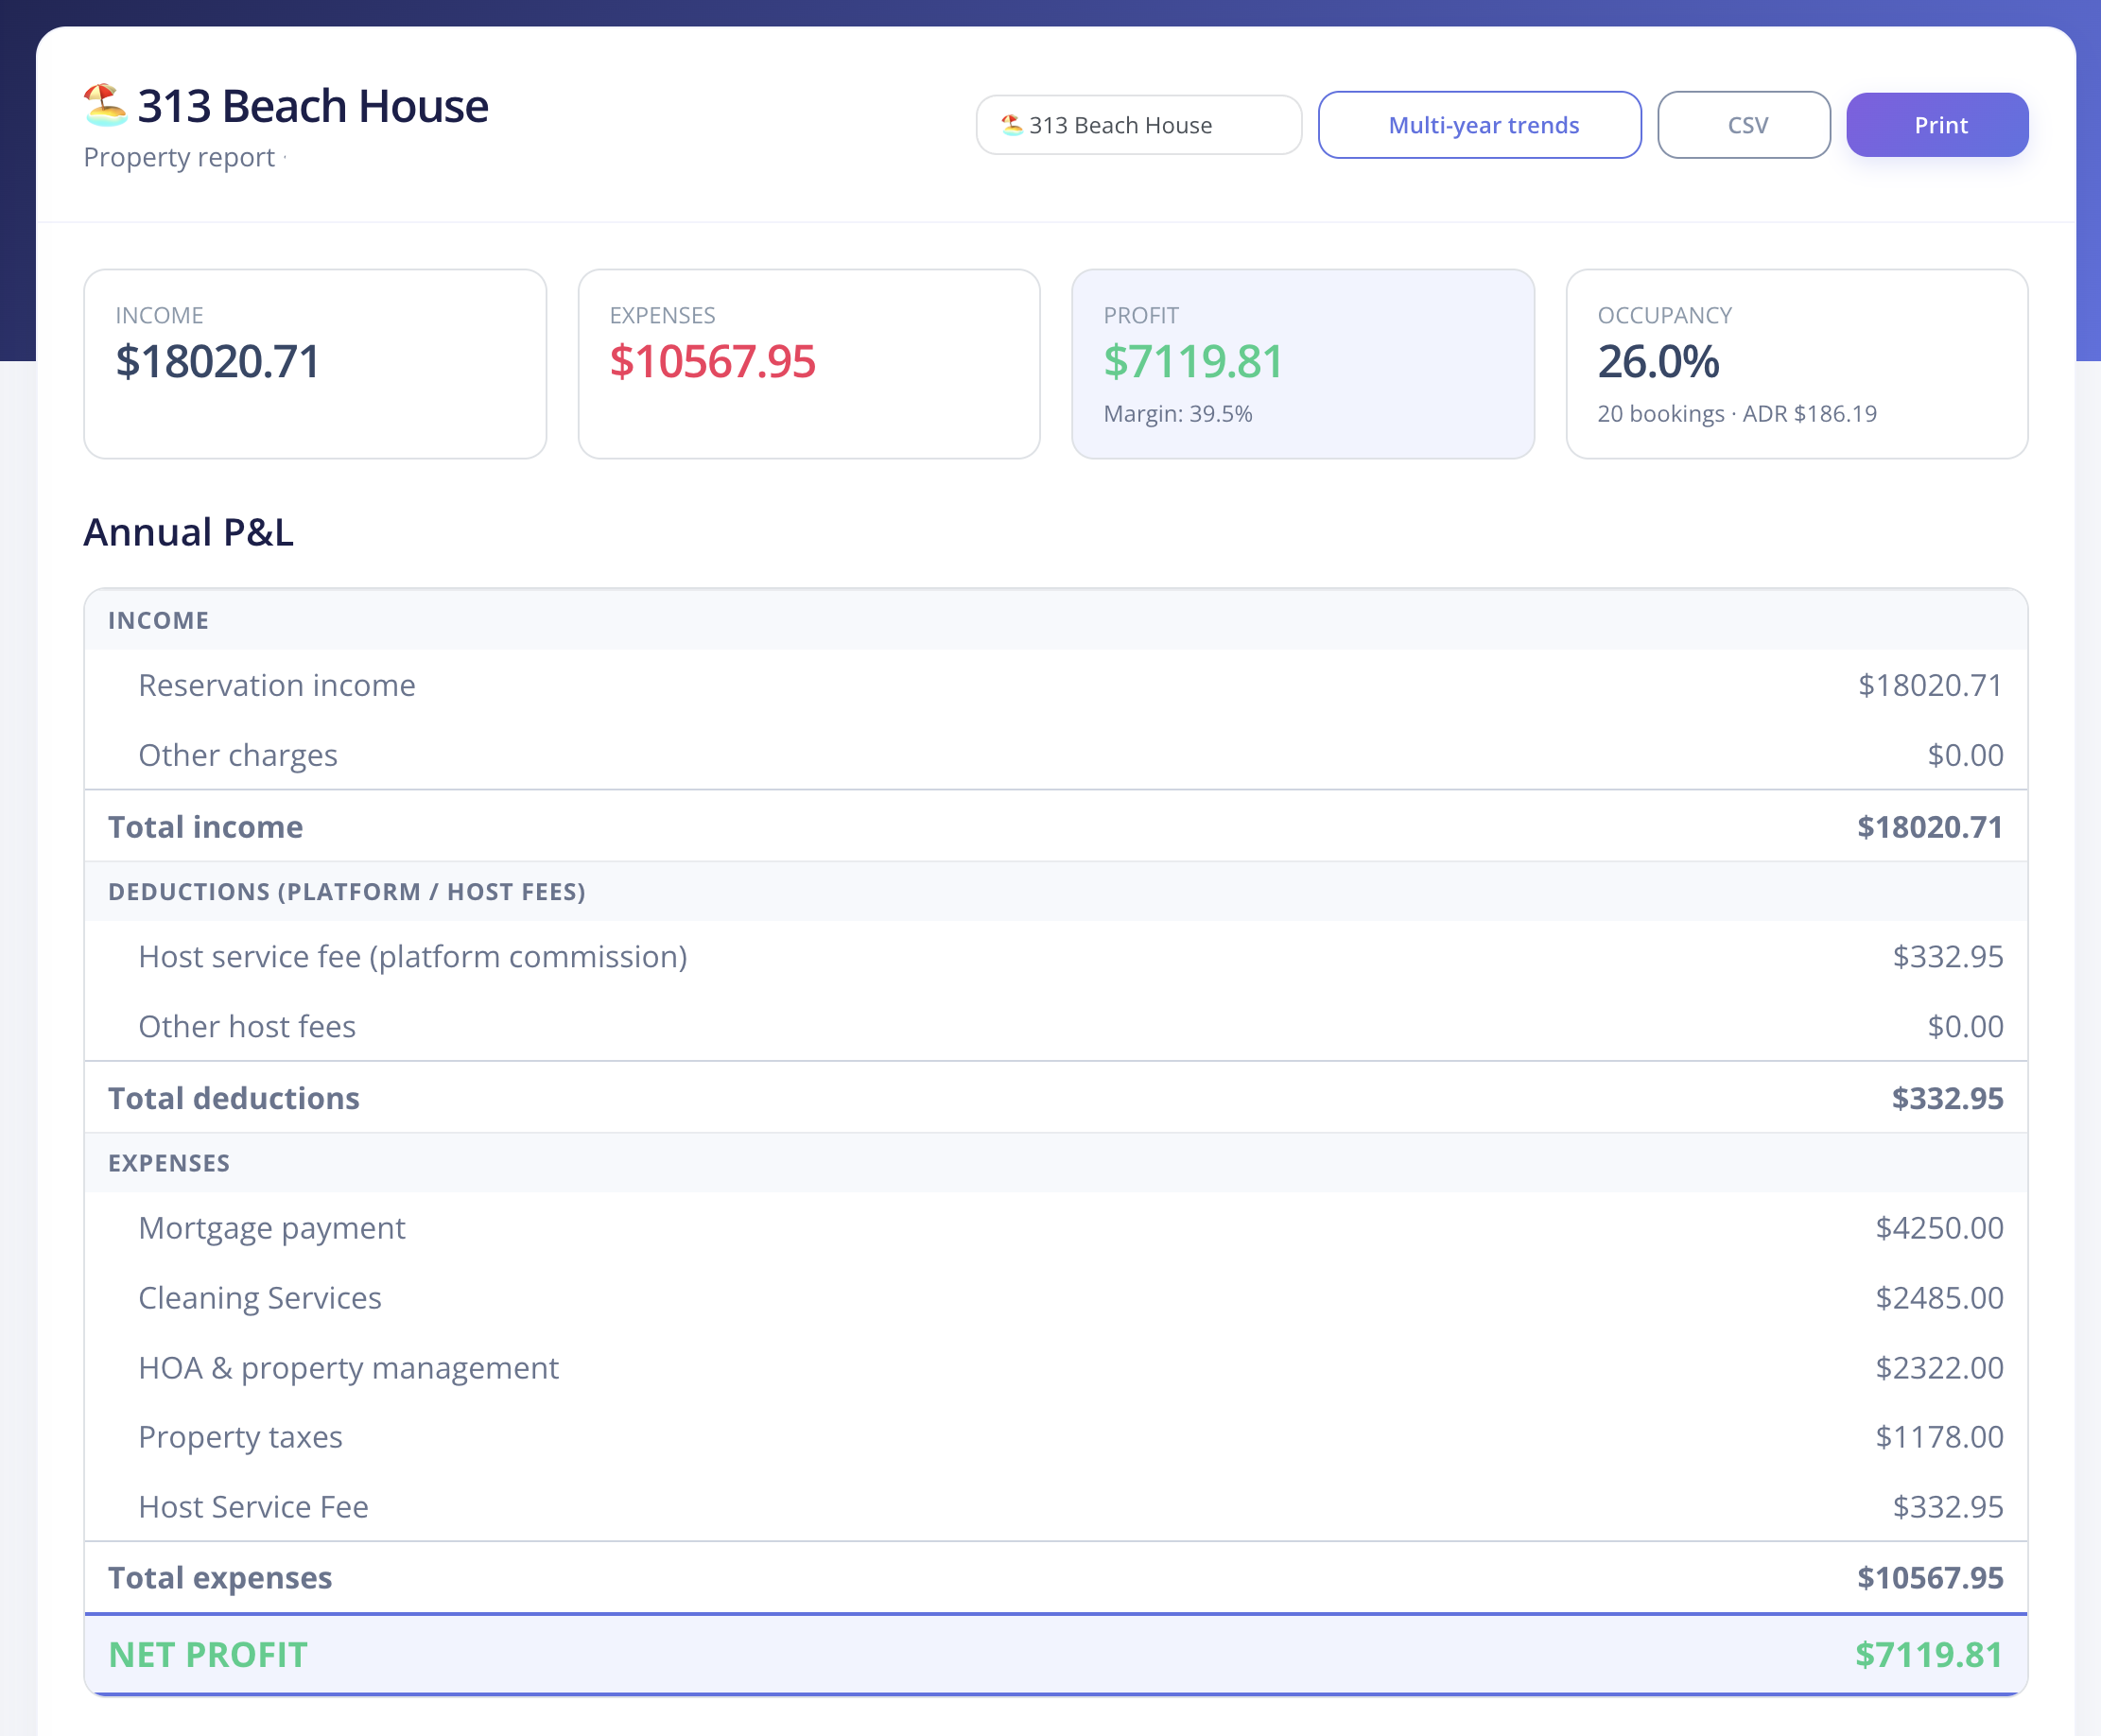
Get complete clarity on your rental finances
Generate reports tailored to your needs. Break income, expenses, and occupancy rates down by property, platform, or time frame so you see the exact insight you came for.
Customizable reporting
Reports by property, platform, or time period. Individual properties or full-portfolio comparisons — fully customizable.
Visual insights
Clean, easy-to-read charts that surface trends and patterns. Make decisions based on what's actually happening in your business.
Flexible data combinations
Mix and match data points to generate the exact report you need. Income by platform, expenses by property, occupancy year-over-year — your call.